PTE Describe Image Bar Graph Examples With Answers
PTE Describe Image Bar Graph – You have 25 seconds to recognize the image. Describe the image including important keywords in your own words in about 40 seconds. Here is – PTE Describe Image Bar Graph Sample Questions and Answers, Practice Test No. 5.
In case you find it difficult to explain PTE Describe Image, learn how to describe image in PTE from our experts.
Don’t forget to write your own answer in the comment box.
PTE Describe Image Bar Graph – Practice Test 5
# PTE Describe Image Bar Graph – Question no. 1
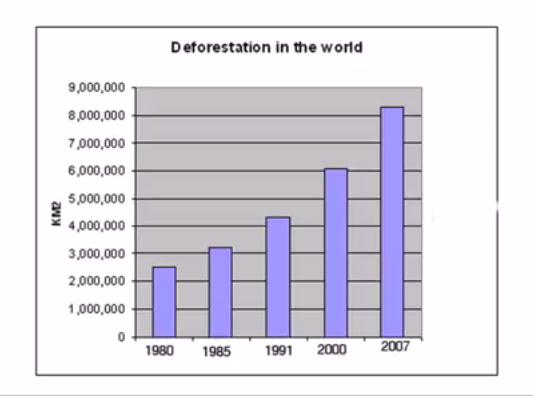
This bar chart represents the Deforestation per square kilometre in the world from 1980 to 2007. During 1980 about 2.5 million square kilometres land was logged. In the next 5 years additional 0.5 million kilometres were cleaned of the trees. Approximately 2 million square kilometres of land was deforested in the year 1991, 2000 and 2007. In conclusion, the rated at which the land deforested was incremental which is not very promising for the better future.
# PTE Describe Image Bar Graph – Question no. 2
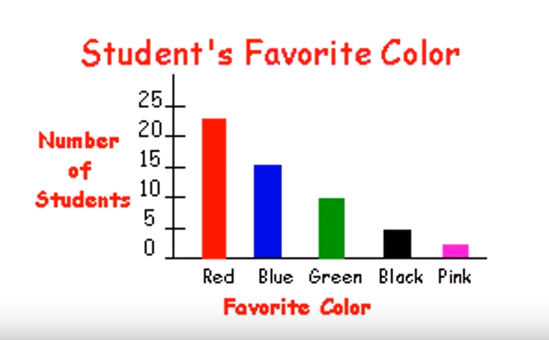
This bar chart represents the students favourite colour. This survey included responses from 25 students. About 23 students responded that their favourite colour is red while 15 stated that they love the blue colour. About 10 stated they fancy green and five for black colour. Least number of students liked pink colour. In conclusion, it is clear that red is the most favourite colour and pink is the least selected colour by the students of this survey.
# PTE Describe Image Bar Graph – Question no. 3
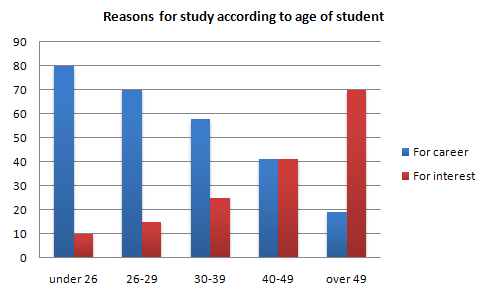
This bar graph represents the reasons for studying according to the age of students. About 80 students under age 26 chose study to develop their career, while only 10 are doing it because studying is their interest. There are equal number of students in the age group of 40 to 49 who choose studying is a hobby and as a career. On the other hand, students over the age 49 prefer studying because it is their interest. In conclusion, younger students study for making their career and older students study because it makes them happy.
To stay updated for more PTE Describe Image Bar Graph Questions along with Answers, like us on Facebook.