PTE Describe Image Examples – Table and Line Graph
PTE Describe Image Examples – You have 25 seconds to recognize the image. Describe the image including important keywords in your own words in about 40 seconds. Here is – PTE Describe Image Examples – Table Diagram and Line Graph Sample.
In case you find it difficult to explain Describe Image PTE, learn how to describe image in PTE from our experts.
Don’t forget to write your own answer in the comment box.
PTE Describe Image Examples
# Describe the given Table Diagram
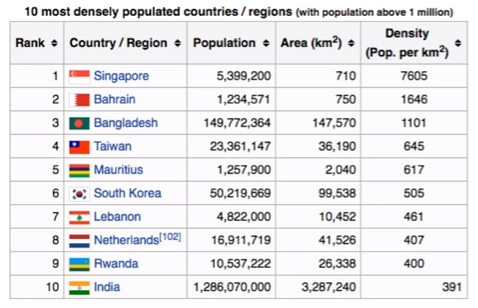
The table shows the rankings of the top ten most densely populated countries and regions in the world. It is important to note that the list considers only regions with the population more than 1 million. At the top of the chart, there is Singapore with a density of 7605 persons per square kilometer. Next is Bahrain with almost one-fifth of the density of Singapore at 1646. Bangladesh has the third highest density at 1101. Taiwan, Mauritius, South Korea, Lebanon, Rwanda, and India follow next with densities between 645 and 391. It is interesting to note the wide variation in population and land areas between the countries. India has 3287240 km sq compared to only 710 of Singapore.
# Describe the given Line Graph
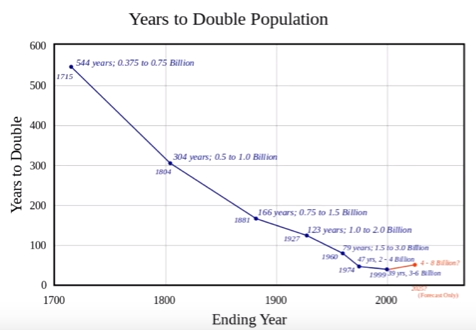
The graph shows how many years it has taken to double the population of a region, possibly the earth from 1700 to 2000 and onwards. The population was 0.75 billion in 1715 and it had taken 544 years to double it from 0.375 billion. In 1881 population stood at 1.5 billion doubling from 0.75 billion in only 166 years which is almost one-third of the earlier time period. In 1960 the population reached 3 billion taking only 79 years to double and in 1999 reached 6 billion taking only 39 years to double. The population will again double in future around 2025 but the rate will be lesser than before.
To stay updated with more PTE Describe Image Examples – Questions along with Answers, like us on Facebook.