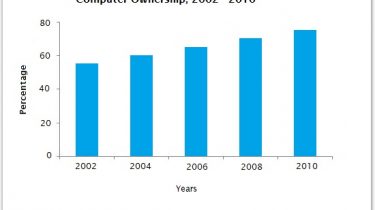
PTE Academic Speaking Bar Chart Graph Diagram Mock Test 14
Describe Image (BAR DIAGRAM) – Study the pie chart in 25 seconds and describe it in 40 seconds.Here is PTE Academic Speaking Bar Chart Graph Diagram Mock Test 14. Important Note: You are not expected to explain the whole image in 40 seconds. Just explain the key points. In case you find it difficult to explain, learn how to describe an image. PTE Academic Speaking Bar Chart Graph Diagram Mock Test 14 # Describe the given Bar Graph. The bar […]
Read more