PTE Describe Image Practice Test 2 – Pie Chart Diagram Questions
PTE Describe Image Practice Test – You have 25 seconds to recognize the image. Describe the image including important keywords in your own words in about 40 seconds. Here is – Pie Chart PTE Describe Image Practice Test 2.
In case you find it difficult to explain Describe Image PTE, learn how to describe image in PTE from our experts.
Don’t forget to write your own answer in the comment box.
PTE Describe Image Practice Questions Online
# PTE Describe Image Practice Question 1
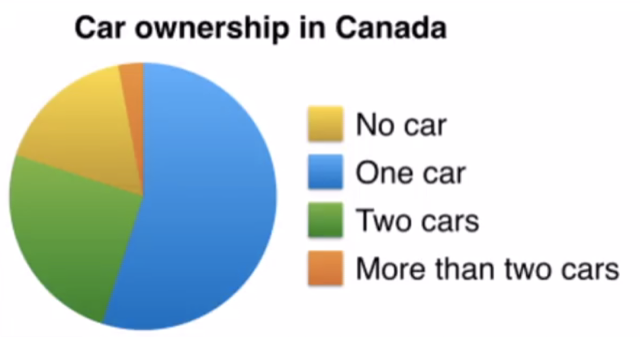
This pie chart represents the car ownership statistics in Canada. The majority of the population possesses at least one car. One-quarter of the total population of two cars while a very small number of car owners stated that they have three or more cars. About twenty percent of the population does not possess any four wheelers. In conclusion, about eighty percent of the population was managed to have a car still a significant number of people are without a proper family vehicle.
# PTE Describe Image Practice Question 2

The pie chart represents the proportion of Post-secondary degrees awarded during the year 1997-98. The highest degrees were awarded to first professionals at 47%. It was followed by associate’s degrees at 27%. 20% degrees were awarded for students who completed master’s well smallest proportion were for bachelors and doctoral degrees programs. In conclusion, the highest number of degrees were awarded for first professional’s while the lowest number of degrees were awarded to candidates who completed their doctoral degree program.
To stay updated for more PTE Describe Image Practice Tests – Questions along with Answers, like us on Facebook.