IELTS & PTE Comparison chart – Academic Pie Chart Solved Questions
Describe Image (Pie Chart) – Study the pie chart in 25 seconds and describe it in 40 seconds.Here is IELTS & PTE Comparison chart – Academic Pie Chart Solved Questions.
Important Note: You are not expected to explain the whole image in 40 seconds. Just explain the key points.
IELTS & PTE Comparison chart – Academic Pie Chart Solved Questions
# Describe the given Pie-Chart.
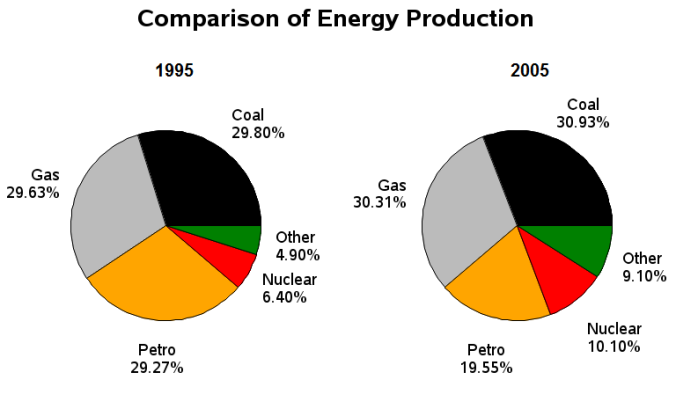
The two pie charts show the information about comparison of energy production measured in percentage in two different years 1995 and 2005. It can be clearly seen that percentage of coal and Gas minor increased in 2005 but production from petro was decreased from 29.27% to 19.55% in 2005. Apart from that, production from Nuclear was almost double in 2005 that was 10.10%. To conclude, energy production from nuclear moved further.
RECOMMENDED: – How To Describe Pie Chart In PTE
# Describe the given Pie-Chart.
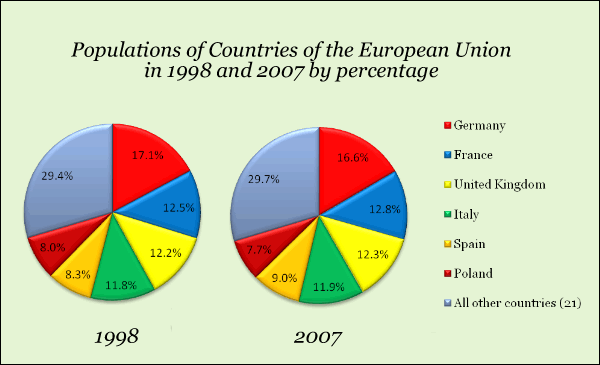
This pie chart compares the population propositions in the Europeans countries between the year 1998 and 2007. The population of Germany and Poland decreased while the population of France, Italy, Spain and United Kingdom increased. In conclusion, in the period of 9 years, there was an overall growth in the population. However, the increment was minor.
# Describe the given Pie-Chart.
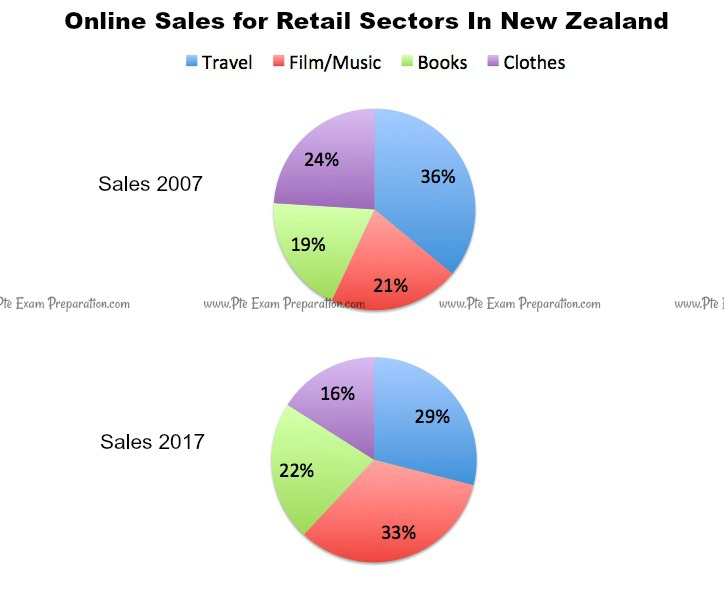
The two pie charts illustrate the proportion of online sales for retail sectors in New Zealand. This pie chart summarises the difference in sales for the years 2007 and 2017. The categories of items sold include travel, film/ music, books and clothes. The smallest portion of sales was for books in 2007 with 19% and a minor change of just 3% could be seen, accounting for 22% of the total in 2017. Travel holds the largest proportion of sales (36%) in 2007 and decreases by 7% in 2013. By 2017, the proportion of clothes like books and travel had changed, although not drastically. Clothes had become the lowest amount of sales at 16% in 2017. Film/music accounting for 21% in 2007 become the biggest seller with 33% of the total.
Practice More – PTE Academic Describe Image With Answers
To stay updated, like us on Facebook.