Practice Repeated Describe Image in PTE – Bar Graph Questions
PTE Describe Image – You have 25 seconds to recognize the image. Describe the image including important keywords in your own words in about 40 seconds. Here is – Repeated Describe Image in PTE – Bar Graph Questions.
In case you find it difficult to explain, learn how to describe an image.
Don’t forget to write your own answer in the comment box.
Practice Repeated Describe Image in PTE – Bar Graph Questions
# Describe the given BAR GRAPH image
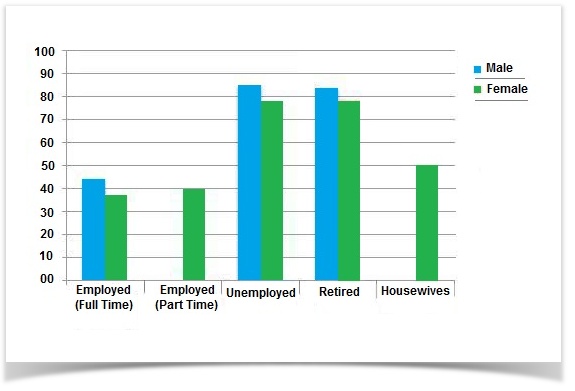
The Bar graph shows the amount of leisure time enjoyed by both of the genders of different employment levels. The highest leisure time enjoyed by Unemployed & retired men – women, that was approximately 85 and 83 followed by housewives which have 50 hours of leisure time. No data has been provided for the part-time employed and house-staying men. On the flip side, full-time employed men & women have comparatively less leisure time.
# Describe the given BAR GRAPH image
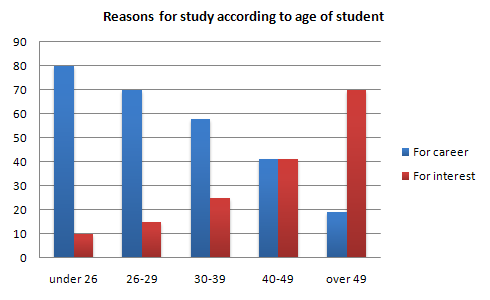
The bar graph represents reasons for study according to age of students for career and for interest at different age groups. The highest reason for study for under age 26 students were for career that was 80% and least reason was for interest that was 109%. At the age of 40-49, reason for career and interest were same that was 40% whereas over 49 students were studied for interest and show less interest in the career. To conclude, with the passage of time reasons for career moved for interest at different age factors.
# Describe the given BAR GRAPH image
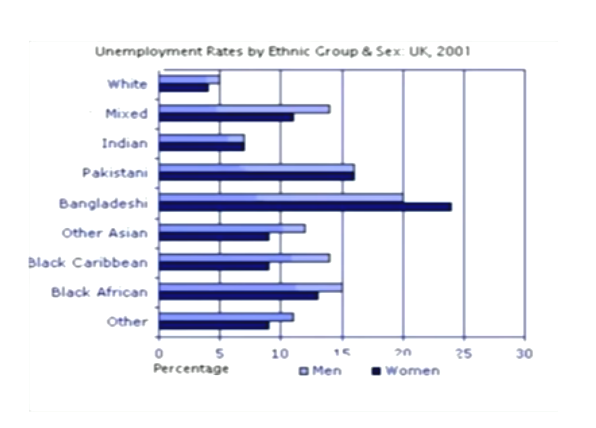
The bar shows the information about unemployment rated by ethnic group by both of the genders in the UK in 2001 measured in percentage. The highest unemployment rate was found in Bangladeshi that was 15% and approximately 24% for men and women respectively. The unemployment rate was equal for men and women for Indian and Pakistani. The least unemployment percentage was visible for white. To conclude, it can be said that unemployment rate in men was higher than the unemployment rate in women except in Bangladeshi.
# Describe the given BAR GRAPH image
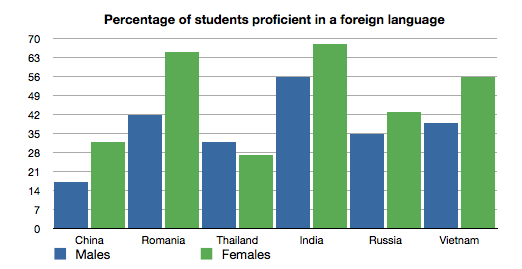
The bar chart shows the percentage of students proficient in a foreign language in six nations – China, Romania, Thailand, India, Russia, and Vietnam. The highest percentage of students was recorded from India that approximately 63% and 56% for females and males followed by the percentage of students from Romania and Vietnam. The least percentage of students were found in Thailand who were not able to use the foreign language. To conclude, among all nations, the percentage of women for good skill was higher than the percentage of men except Thailand.
These are some Repeated Describe Image in PTE – Bar Graph Questions. Share your own answers in the comment box below.
To stay updated, like us on Facebook.