PTE Exam Describe Image – Bar Diagram Full Explanation With Solution
Before starting or practicing PTE Bar Diagram exercise, we suggest you all understand the basic rules or guidelines to make PTE describe Image paragraphs. Tips to remember in making PTE describe images.
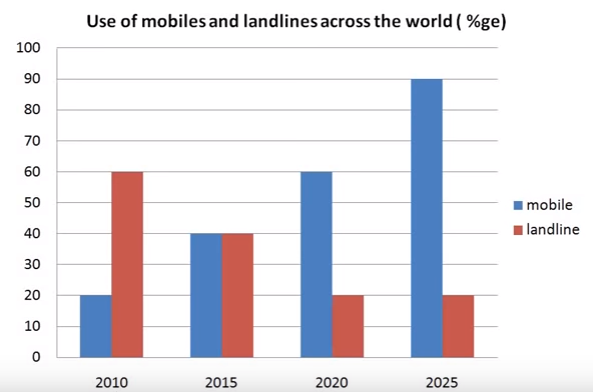
1.- First, we have noticed in our preparation time “Heading, type, key, X axis and Y Axis. So we will say – The bar diagram explains/says/illustrates the use of mobiles and landlines across the world from 2010 to 2015 and the projected value for 2020 and 2025.
2.- Next is the second sentence, we start with minimum or maximum and with one variable. The use of mobile was minimum in 2010 which was approximately 20%. The use of mobile was minimum in 2010 and then it increased significantly in 2015 and in 2025, it is anticipated because this is in future. It is anticipated that 90% of the world’s population will use mobile.
3.- Next, the third sentence will be the landline. The use of landline was maximum in 2010 and then it decreased significantly in 2015 and it is anticipated that in 2025, the use of landline will be 20%.
4.- So in conclusion, in future, the mobile use will be more as compared to landline use.
So this is how you can explain in 4 to 7 sentences.